Project 2:
Shoaling Analysis
Introduction
The purpose of
this shoaling analysis was to gain information on the dredging needs within
Cape May County waters. Shoaling is
the reduction of water depth due to bay floor elevation changes caused by the
deposition of sediment. In navigable
waterways, namely navigation channels and marinas, shoaling is a hazard as it
impedes the safe passage of boats. As
a result of shoaling, recreational waterways are dredged to provide ample
water depth for safe passage of vessels.
For this shoaling
analysis, past, present, and future conditions were investigated in the form
of a historical data review, field study, and future assessment. The historical data review included records
of federal, state, municipal and private dredging projects (including permits
and past dredging files). The current
conditions were identified through sediment sampling field study. The future assessment of dredging needs,
within Cape May
County, was based on
discussions with state employees, coastal engineers, scientists, and marina
and boat owners and extrapolation of past trends.
Using all the
information gathered, the shoaling analysis identified priority dredging
areas in Cape May
County. Not included in this study are the five
federally maintained inlets (Cape May, Hereford, Townsend, Corson, and Great
Egg Harbor).
Cape May
County Waterways
Cape
May County is the southern-most county in New Jersey. The intricate system of channels and bays
occupy more than 15,000 acres of open water in Cape May County. The study areas for the shoaling analysis
are the tidal channels and bays that extend south from the Great Egg Harbor Bay
to the Cape May
Harbor (Figure 1). Located within the meandering channels and
bays are federal, state, and local navigation channels as well as numerous
public and private marinas and boat slips.
The waterways traverse through extensive tidal saltwater marshlands
that are between 2 to 4 miles wide (mainland to barrier island) located
behind approximately 30 miles of barrier islands. The waterways are used by local
recreational boaters, local commercial fisherman, and boaters traveling
through the area via the NJIWW. Peak
use is during the summer months. Five
inlets (Cape May, Hereford, Townsends, Corson,
and Great Egg
Harbor) separate the barrier islands
and provide access to the Atlantic Ocean. In addition, a Federally-maintained canal
traverses the southern tip of the Cape May
County uplands to reach Delaware Bay. Shoaling
within this area is not constant with respect to time and location. The movement and deposition of sediment
relies on a source of sediment and subsequent entrainment, transportation,
and deposition.
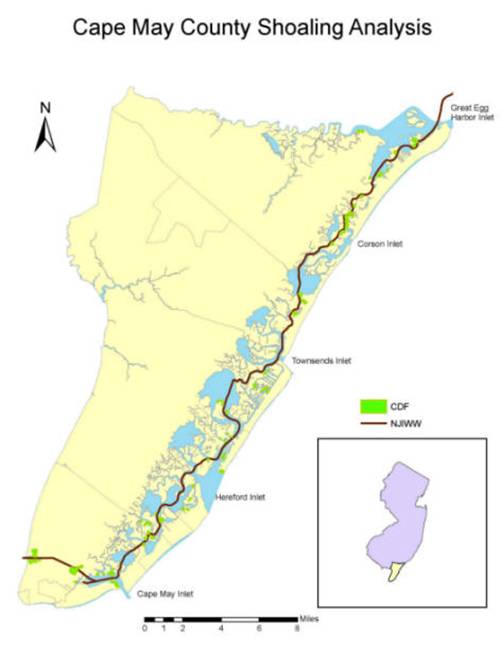
Figure - Cape May County
study area
Sediment Sources and
Transport
There are
multiple sediment sources in the study area and these are separated into two
groups. The first group of sources
includes sediment that must be transported into the study area via local
runoff, upland inflow, or from the nearshore.
Local uplands provide sediments directly to the Cape May County
coastal waterways through direct drainage and storm runoff. Upland inflow sediment sources for this
area are the rivers and streams (Tuckahoe
River, Middle River, Great Egg Harbor River,
and Patcong Creek) that flow into the Great Egg
Harbor Bay. Both local runoff and upland inflow are
dependant upon local rainfall to entrain the sediment and transport it to the
study area. Nearshore sediments can
also serve as a source of sediment that travels into the tidal bays and
channels. Wave energy and longshore
currents work together to suspend and transport sediments to the inlets. Flood tide currents carry the sediments
into the bays and channels to be deposited. This process is usually localized
to inlet areas and immediately adjacent waterways.
The second group
of sediments consists of previous deposits of marsh muds, organic material,
and the bay floor. Bay floor areas
adjacent to navigation channels and marinas are a common source for shoaling
sediment as dredged channels tend to maintain a natural equilibrium with
adjacent natural contours. These areas
are relatively shallow when compared to the unnatural dredged depths of
channels and marinas. These sediments
become resuspended into the water column via currents and wave action.
Wind waves, boat wake, currents, and
propeller scour can cause marsh erosion allowing the marsh sediment to slump
into open water and become entrained in the water column. Once the sediment is entrained into the
water column it can be transported and deposited, usually in areas with
extremely low current profiles. More
energy is required to transport larger, denser sand particles than compared
to smaller, less dense silt and clay particles. The relationship between energy, in the
form of a current velocity, versus grain size is shown in figure 2 which was
original to “Hjulstrom, F, 1935, Studies of the Morphological Activity of Rivers
as Illustrated by the River Fyris, Bull. Geol. Inst. Uppsala, 25”.
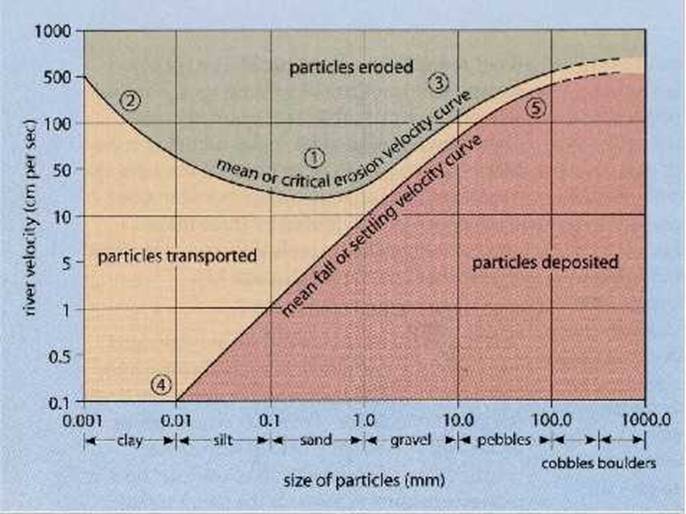
Figure 2 - Erosion-deposition
criteria for different grain sizes
(http://www.slideshare.net/geographyalltheway/ib-geography-drainage-basins-hjulstrom-curve)
The dominant
means of transportation of sediment in Cape May County
coastal waterways is from tidal currents.
The ocean tide, a cycle of ebb and flood, propagating through the
inlets and into the bays and channels, creates tidal currents. The flow rate at which the tide propagates
is dependant upon the local water depth.
As tides pass in and out of the inlets, the water levels of the
channels and bays rise and fall with an associated lag. The direction and magnitude of the currents
is highly dependant upon the location and morphology of the bays and channels
as well as the tidal stage. At the
period of high and low tide there is slack water where velocity is zero. Currents develop during the transition
between flood and ebb tide. In general
the maximum rate of ebb-tidal flow occurs late in the ebb-tidal cycle when
the water level is below tidal mud flats and is therefore, only found in the
main, deep channels leading to the inlet.
Channels and bays located closer to an inlet will generally have a
greater magnitude current. Areas with relatively
narrow, well defined cross sectional areas such as tidal channels will have greater
current velocities when compared to larger open areas such as bays. In addition to the tidal currents, there is
a fluvial influence at the northern part of the study area (Ocean City)
from upland flow into the Great Egg Harbor Inlet. The fluvial inflow into the bay skews the
tidal currents creating larger ebb tidal current and smaller flood tidal
currents when compared to the surrounding area. Using engineering judgment and local grain
size data (discussed later) estimates of tidal current magnitude and
direction were developed. The expected
flood tide currents are shown in Figure 3.
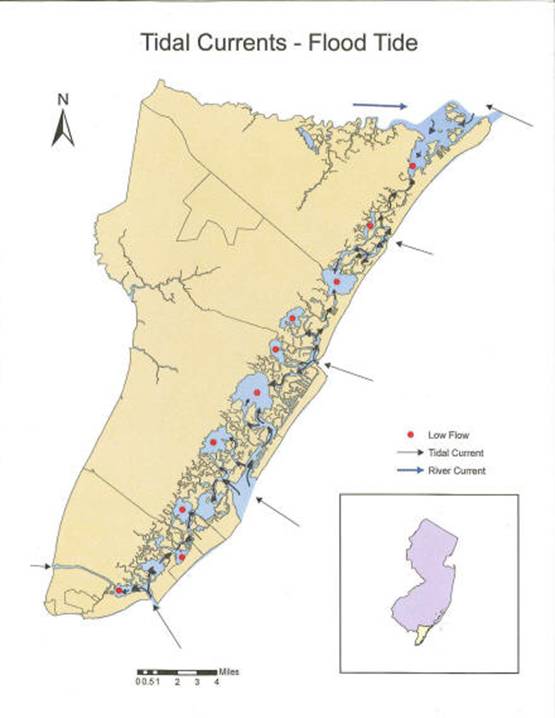
Figure 3 - Predicted flood tidal
currents
Deposition of
entrained sediments occurs in low energy areas. The amount of deposition depends on
location and time. The energy
threshold required for sediment deposition is dependant on the sediment grain
size and density. This accounts for
higher concentrations of sands located near inlets and in areas of stronger
tidal currents. Silts and clays are
often found in the shallow back bays and mid island channels where energetic
conditions are minimized. This
sediment distribution can be seen in Figure 4 (see discussion below). In addition, sharp turns and bends
(meanders) in the channels also are regions for sediment deposition because
of decreasing rates of flow that develop toward the inside curve of the
meander, causing deposition of sediment along the inside bend of turns.
Canals and cuts that do not shorten the flow distance usually shoal. Man made cuts acting as substantial
short-cuts frequently accelerate flow rates and produce channel widening or
deepening with consequent shoaling where the flow returns to the natural
channel. Flows through low velocity
cuts are usually quiescent and cannot support sediment movement through the
cut. This decay in flow rate is also the prime reason for rapid,
fine-grained deposition in marina harbors because they too, are areas of open
water where tidal flow has no natural reason to exist. As a result, suspended sediment falls onto
the marina bay floor at times of slack water (four times each day).
In addition to
transport of entrained sediments, shoaling may also occur via bedload
transportation. Bedload transportation
is the movement of sediment along the sediment bed without entraining the
sediment into the water column. The
primary indicator that bedload transport is occurring is the presence of
bottom features such as ripples or larger features known as dunes or sand
waves. These features move down
current as the water flows over the bed.
Fluid shear is the mechanism rolling the sand particles into the
bedforms present on the bed. Size and
spacing is proportional to current velocity.
Bedload transportation from relatively shallow areas into deeper
channels and marinas creates shoals. The differing bottom sediment
composition lends clues to sediment sources and local currents.
Physical Properties of
Sediment in Cape May County
During the field
campaign in 2007, sediment samples throughout the study area were collected
and their physical properties analyzed, namely grain size. Table 1 provides the location, elevation,
and physical properties of the samples collected in Cape May County. This data was extrapolated over the entire
study area to create Figure 4.
Table1 - Sediment sample data
summary

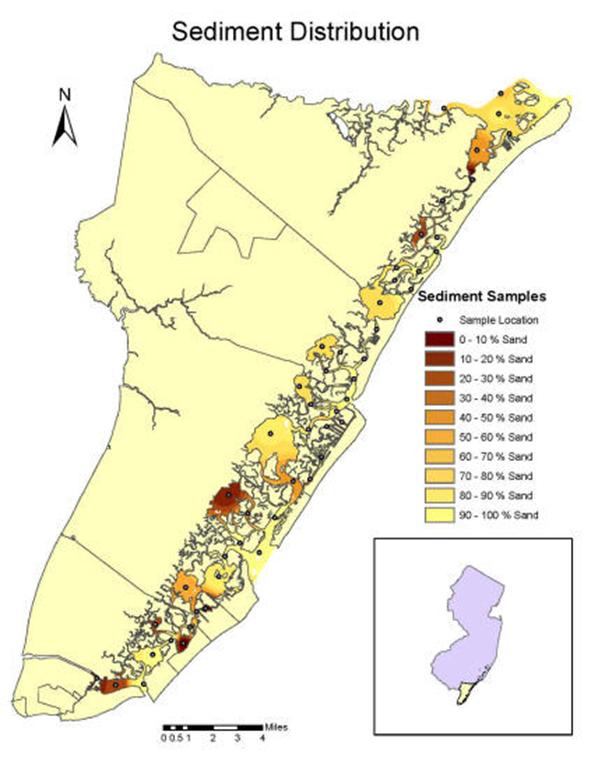
Figure4 - Cape May County
grain size distribution
In general, the
study area is largely comprised of sand-sized sediments with isolated
locations having a high percentage of fine silts and clays. In the above figure, lighter areas
represent bottom sediments with a higher percentage of sands (less fine silts
and clays) while darker areas represent bottom sediments with a lower
percentage of sands (more fine silts and clays). Locations of higher flow (inlets and flow
through channels) have a higher percentage of sands while the low flow, low
energy location have a higher percentage of silts. The areas with a higher percentage of silts
and clays include; the west end of Cape May harbor, Sunset
Lake, Post
Creek Basin,
Jenkins Sound, Pennsylvania
and Princeton Harbor, Corson Sound, and Upland
Thorofare. Most of these locations are
shallow open body areas with limited flow regimes that allow the fines to be
deposited. Fine silts and clays have a
limited beneficial reuse.
Historical
Dredging Data
A thorough review
of available historical dredging data in Cape May County
provided an overview and identified trends of past dredging projects. The major sources of the data include a
2003 U.S. Army Corps of Engineers Report (New Jersey Intracoastal Waterway
Preliminary Draft Feasibility Report & Integrated Environmental
Assessment), NJDEP Office of Sediment Technology permit data, and NJDEP
Bureau of Coastal Engineering (BCE) information. Each set of data is discussed below.
NJDEP Permit Data
In order to
legally dredge in the waterways of New
Jersey, a Waterfront Development permit must be filed
with the NJDEP. All dredging activity
is subject to USACE examination; however, for the purpose of this project,
USACE permits were not reviewed because they duplicate the NJDEP
process. Permitted dredging projects include
maintenance dredging of boat slips and state and local channels as well as
dredging for new waterfront developments.
These records were provided by the NJDEP Office of Dredging and
Sediment Technology (ODST) for the entire state for permits filed between
1998 and 2008. Not all of the
information provided in the database was complete. Missing information was gathered by
requesting to review specific permits through the NJDEP Office of Public
Record (OPRA).
Not all waterway
areas are dredged in Cape May
County as some areas
are naturally relatively deep.
Dredging projects generally occur where channels or marinas are
shoaling or where new areas are to be developed. The NJDEP permit data for Cape May County
was divided into five regions separated by inlets. These regions are shown in Figure 5 and a
summary of the region is presented in Table 2.
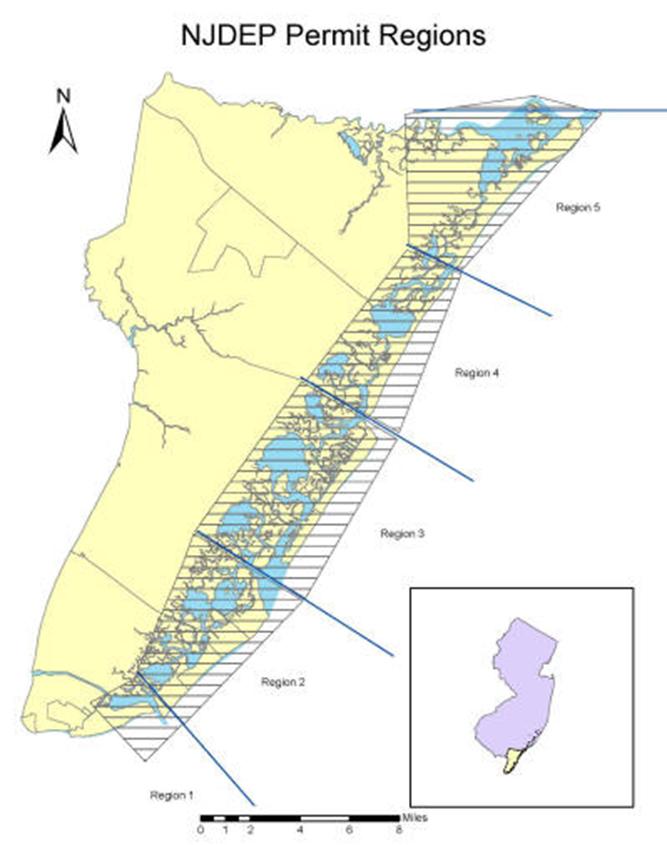
Figure5 - NJDEP dredging permit
region identification
Table2 - NJDEP dredging permit
region summary

Dredging permit
data located in each region was grouped to determine the dredging demand and
estimate the shoaling rate. The
dredged material from these projects is placed in an upland area either a CDF
or an on-site facility. A summary of
the dredging permit information for each region in Cape May County
is shown in Table 3.
Table3 - NJDEP dredging permit
data summary

USACE NJIWW
report
The U.S. Army
Corps of Engineers published a report "Preliminary Draft New Jersey
Intracoastal Waterway Draft Feasibility Report & Integrated Environmental
Assessment" (USACE 2003) in which they evaluated the maintenance
dredging needs of the NJIWW. The NJIWW
is a series of channels that runs from the Great
Bay to Cape May
in NJ (Figure 6). The original
maintenance depth of the channel was 12 feet.
However, in 1991 the depth limit was reduced to 6 feet mean low
water. The USACE-Philadelphia District
is responsible for maintaining the channels, which includes maintenance dredging. The state is responsible for providing
placement options for the dredged material.
Historically, maintenance dredging has been limited to specific
reaches of the NJIWW where shoaling is the greatest. These reaches in Cape May County
are identified in Figure 6. Reach 1
(R-1), located in the Cape May
Canal is not part of
the study area.
In the Cape May
County Shoaling Analysis study area, there are 13 distinct maintenance
dredging reaches, Reach 2 to 14 (Figure 6).
A summary of dredging activities in these reaches are summarized in
Table 4. These reaches, totaling 30.3
miles, represent approximately one half of the total NJIWW in Cape May County. To compare the reaches, approximate
shoaling rates were calculated assuming a channel width of 100 feet. In general, yearly shoaling rates are not
linear but are a function of time and the difference between the native bed
elevation and dredged bed elevation.
Shoaling rates tend to decrease in time as the differential between
the two bed elevations decreases. The
calculated shoaling rates indicate the variance in shoaling between the areas
which is based on the channel location, type, and sediment characteristics of
the reach. The surrounding sediment
varies by location, usually related to distance from one of the inlets. Using nautical charts and sediment data,
the reaches are characterized according to location, reach distance,
sediment, and channel (Table 5).
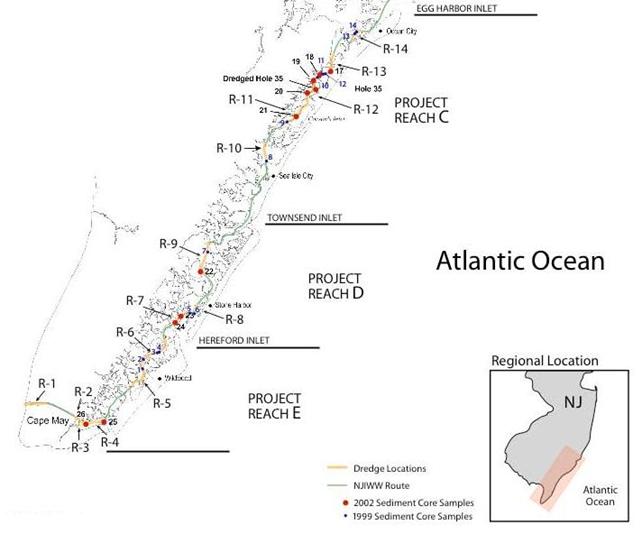
Figure6 - NJIWW NJDEP reach
designation (USACE 2003)
Table 4 - NJIWW dredging data summary
Table
5 - NJIWW reach descriptions

NJDEP BCE State
Dredging Locations
The NJDEP Bureau
of Coastal Engineering is responsible for all state sponsored dredging activities. Based on interviews with BCE personnel and
a review of available BCE project files, several areas of Cape May County
that have been dredged regularly were identified. These locations are highlighted with yellow
in Figure 7.
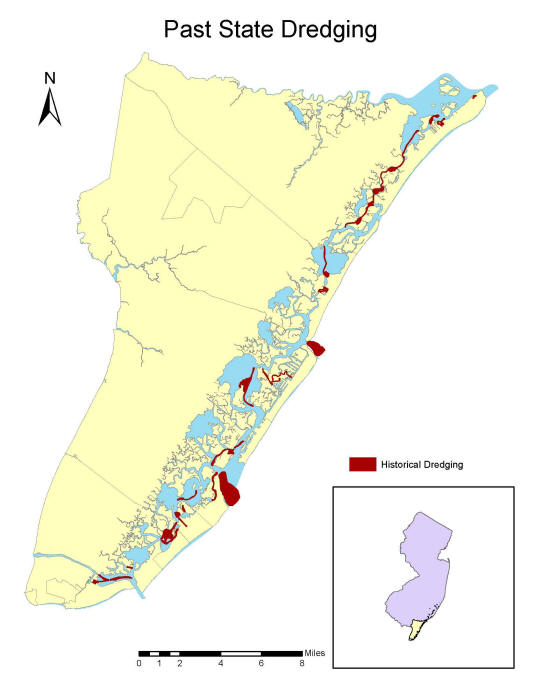
Figure7 - Reoccurring state
dredging locations
Historical
Dredging Trends
Historical
dredging data is very valuable for identifying dredging trends in Cape May County and predicting future dredging
needs. Historically, funding and
placement options were available for dredging projects. Therefore, once an area had shoaled to a
certain elevation it would be dredged.
Each dredging project is different with respect to material quantity,
location, area, dredge depth, reoccurrence interval, and placement. Using the available historical information,
priority dredging areas were identified based on approximated shoaling rates
and historical dredging demand relative to other projects within Cape May County. Although there are many areas throughout
the county with dredging trends the following areas have the highest
predicted dredging demand from historical sources and are shown in Figure 8 :
·
Cape May Harbor
·
Ludlam Bay
·
Crook
Horn Creek
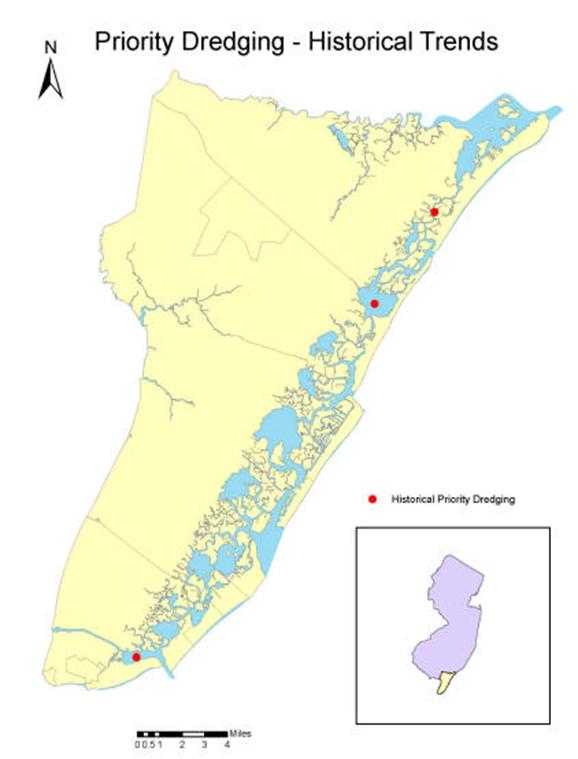
Figure8 - Priority dredging
location from historical trends
The area in and
around Cape May
Harbor is the main
priority dredging location based upon historical dredging trends. Cape
May Harbor
serves as a major navigational waterway for recreational and commercial
boats. It has the highest shoaling
rate and dredging demand from all the historical sources. The NJIWW channel that passes through the
harbor shoals at a rate of nearly 2 ft per year and has a 20 year dredging
demand of 1,200,000 cy. In addition to
the NJIWW there are three channels that are routinely dredged; Devils Reach,
Schellenger Creek, and Spicer's Creek as well as multiple large marinas. A majority of the sediment dredged from
these locations are placed in the USACE Cape May Canal Disposal area as well
as at the Bree-Zee-Lee Marina (Linger Point #1) and Utsch's Marina private
CDFs. The private CDF have capacity
for approximately 10 years (NJDOT OMR 2008).
The sediments in this area range from sands closer to the inlets to fine
silts and clays in the back of the harbor (sediment samples #1, 52, 53). The Cape May
Harbor is located just south of the
Cape May (Cold Springs) Inlet and is connected to the Delaware Bay through
the Delaware Canal.
During the flood tide, water fills the Cape
May Harbor and
flows westward through the canal to the Delaware Bay. Due to the convergence at the canal
entrance there is a low flow zone where shoaling occurs. Another location of shoaling in this area
is at the transition between the inlet and the harbor. Sand from the nearshore is transported in
during a flood tide and deposited at these flood-tidal shoals.
Historical trends
identify Ludlam Bay, located west of Sea Isle City, as a secondary priority dredging
area. The state has identified this
location as a reoccurring dredged project and the USACE report (2003)
estimates a 20-year demand of approximately 300,000 cy with a calculated
shoaling rate of 0.33 ft/yr in the channel. Sediment within the bay is
mostly sand 9(sample #39) and is placed in the Ludlam Thorofare #2 CDF.
This CDF has less than 75,000 cy of capacity remaining.
Historical trends
identify Crook Horn Creek, located west of the northern Ocean City,
as a secondary priority dredging area.
The state has identified this location as a reoccurring dredged
project and the USACE report (2003) estimates a 20 year demand to be about
750,000 cy with a calculated shoaling rate of ~0.3 ft/year in the
channel. Sediment within the channel
transitions from a high percentage of silts and clays in the northern part of
the channel (sample #9) to a mix of sands and fines in the southern part of
the channel (sample # 13). The city
owns one of the primary CDF’s (Crook Horn Creek #1) located 100 yards north
of the former rail link to Ocean City.
Current Dredging Needs
Current dredging
needs have been identified through meetings with the NJDEP BCE, local
municipalities, and local marina owners.
These locations are identified in Figure 9. Neglected maintenance dredging is commonly
due to a lack of funding and placement options. Dredging has not been conducted regularly
and channels have been allowed to shoal.
All anecdotal information points to a serious need for maintenance
dredging on a large scale at most main channels, many minor waterways, and at
most major public and private back barrier island recreational vessel mooring
and berthing areas.
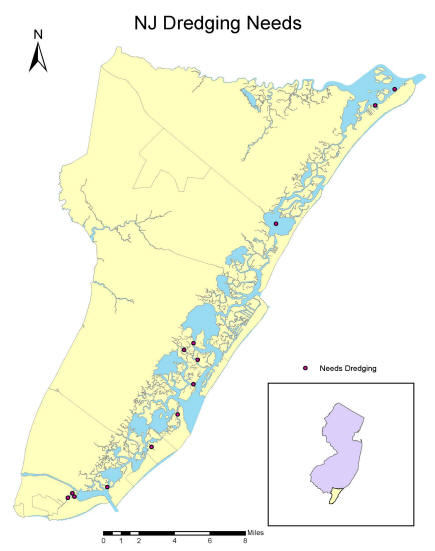
Figure9 - Current dredging needs
One foreseeable
dredging project will occur in the Stone
Harbor waterways. A combination of recent development along
Stone Harbor Boulevard and continued shoaling in the Stone Harbor Canal and
Scotch Bonnet waterways running adjacent to Stone Harbor Boulevard have
resulted in the need to dredge the area.
This waterway runs 3 miles and consists of the channels running
adjacent to Stone Harbor
Boulevard and Scotch Bonnet which intersects the
NJIWW at Great Channel. Using recent soundings collected by the State of New Jersey, March
2008, an estimated dredged volume of 100,000 cubic yards was calculated
assuming that the channel will dredged to a depth of 5 feet MLW and have a
width of 50 feet. If this area were to
be dredged it would exceed the Sanctuary Island CDF, which has been recently
rehabilitated and used for recreational slip sediments. The previous placement option for this
site, Nummy Island CDF, is currently filled to capacity (Figure 10).
In general
dredging projects are located no more than 14,000 feet from a CDF in order to
eliminate the need of booster pumps which increase dredging costs. From the data, there are recurring dredging
needs in the surrounding channels with an 2-3 year interval that would
average around 15,000 cy of material per event. If this trend continues into the future, either
another CDF location must be identified for this material or the current two
sites must be emptied to handle new sediment derived from this set of
waterways. Several projects and
studies have been preformed to test the feasibility of the beneficial reuse
of dredged material in order to increase CDF capacity.

Figure10- Dredged material placement
at Nummy Island
Priority
Dredging Locations Conclusions
In general, most
of the Cape May
County coastal
waterways are in need of some degree of dredging. Priority dredging locations are those which
are currently in need of dredging based on meetings with state and municipal
personnel and selected marina owners (Table 6). Historical priority dredging areas are
based upon the shoaling rate and predicted dredging demand. Historical dredging data and existing
channels with clearly identifiable dredging needs provide the evidence to
identify the priority dredging sites throughout Cape May County. A summary of the priority dredging areas is
indicated below.
Table 6 - Cape May County
priority dredging areas

All available
sources indicate the Cape May Harbor and the waters that flow into it is Cape May County's primary priority dredging
location (Figure 11). This body of
water supports a large number of boating traffic both recreational and
commercial. Historically this region
has been dredged the most from both the NJIWW study data and the dredging
permit data. Additionally, stakeholders
have identified that this region needs to be dredged. The material in this area varies. High percentage of sand sediments are
located near the Cape May Inlet, high percentage of fine silts and clays are
located in the western portion of the Cape May Harbor and a mix of sediments
are located between. Placement options
for materials dredged from this location include USACE Cape May Canal CDF and
two private CDFs (Linger Point #1 and Linger Point #2). It is estimated that at least 10 years of
dredged material can be placed within these sites.

Figure11 - Cape May County
summary
|

